A new study led by researchers at the Johns Hopkins Bloomberg School of Public Health links historic redlining, coupled with ongoing segregation by race and income, to 38% of the nonfatal shooting rate in Baltimore city’s most disadvantaged neighborhoods between 2015 to 2019.
For their analysis, the researchers looked at two examples of structural racism: redlining and racialized economic segregation. Redlining is a term used to describe discriminatory policies that systematically deny or increase the costs of mortgages, insurance, and loans based on the percentage of the neighborhood’s residents who are Black or other racial or ethnic minorities.
For many decades, lending institutions redlined low-income neighborhoods, which often had large populations of people of color, classifying them as investment risks. The practice resulted in neighborhoods with lower home values and fewer services and resources. Combined racial and economic segregation, also known as racialized economic segregation, measures current factors, including race and income.
The analysis found redlining, coupled with ongoing segregation, is linked to 10 additional nonfatal shootings occurring in Baltimore’s most disadvantaged neighborhoods per year, per 10,000 residents.
The study was published online September 1 in Injury Prevention.
“These communities of color are doubly impacted. They have been redlined in the past and are underserved now,” says the paper’s lead author, Mudia Uzzi, a doctoral candidate in the Bloomberg School’s Department of Health, Behavior and Society. “Health equity and racial justice need to be prioritized when developing gun violence prevention policies and interventions.”
More than 5,000 nonfatal shootings have occurred in Baltimore since 2015, according to law enforcement records. These nonfatal shootings present many health and safety problems, including physical injuries, health care costs, and mental health issues like stress, grief, and trauma.
For their study, the researchers drew from nonfatal shooting data from the Baltimore Police Department and population data from the U.S. Census Bureau’s American Community Survey (ACS). The researchers then calculated the annual nonfatal shooting rate for 2015–2019 in 149 census tracts across Baltimore city, scaled per 10,000 residents. The researchers found that nonfatal shootings across Baltimore’s neighborhoods were unevenly distributed.
To determine levels of historical redlining in each census tract, they examined the 1937 Baltimore Home Owners’ Loan Corporation map, which designated specific areas—many of which were historically Black neighborhoods—as “hazardous” for investment. The researchers then calculated what are known as Index of Concentration at the Extremes (ICE) scores, a measure that factors in geographic and social polarization. These researchers used this measure to quantify the concentration of households in census tracts that are most socioeconomically advantaged—non-Hispanic white households with an income over $100,000—versus most socioeconomically disadvantaged—non-Hispanic Black households with incomes below the federal poverty line of $25,000.
These scores were used to identify contemporary levels of racialized economic segregation in each census tract, utilizing the median household income data from the 2019 Census survey.
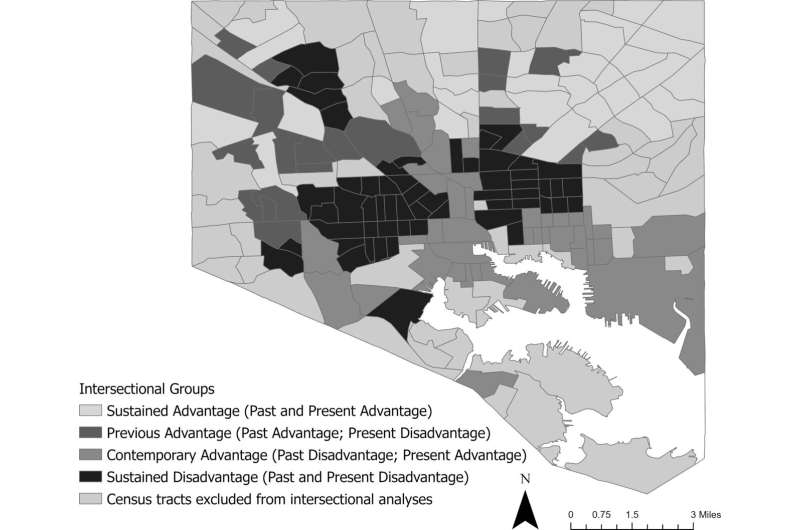
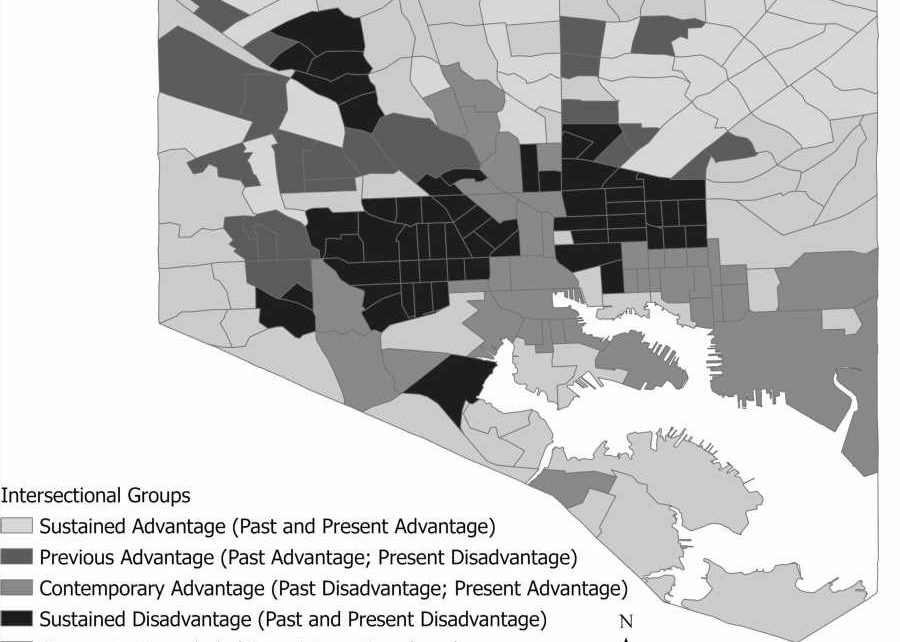
The researchers categorized 149 census tracts in Baltimore into four groups of neighborhoods based on their rates of both historical redlining and contemporary racialized economic segregation. Sustained advantaged neighborhoods had low rates of historical redlining and high ICE scores, indicating high, contemporary socioeconomic status and low segregation. Sustained doubly disadvantaged neighborhoods had high rates of historical redlining, high segregation, and low ICE scores.
Out of the 149 tracts, 38% were doubly disadvantaged over a sustained period and 20% were classified as sustained advantaged. The researchers observed that in sustained disadvantaged neighborhoods, 28 residents out of 10,000 experienced nonfatal shootings each year compared with 4 residents in sustained advantaged neighborhoods. This represents 24 more nonfatal shootings per 10,000 residents per year in sustained disadvantaged neighborhoods versus sustained advantaged neighborhoods.
Source: Read Full Article


